mdadash.backend.analyses.custom_code
Custom user-defined code
Classes
Custom Code |
- class mdadash.backend.analyses.custom_code.CustomCode[source]
Bases:
WidgetBaseCustom Code
This widget allows custom user-defined code to run during widget execution. The run frequency can be every-frame or batch similar to other widgets. User-defined code can be split into two parts - Setup code and Execute code as shown below:
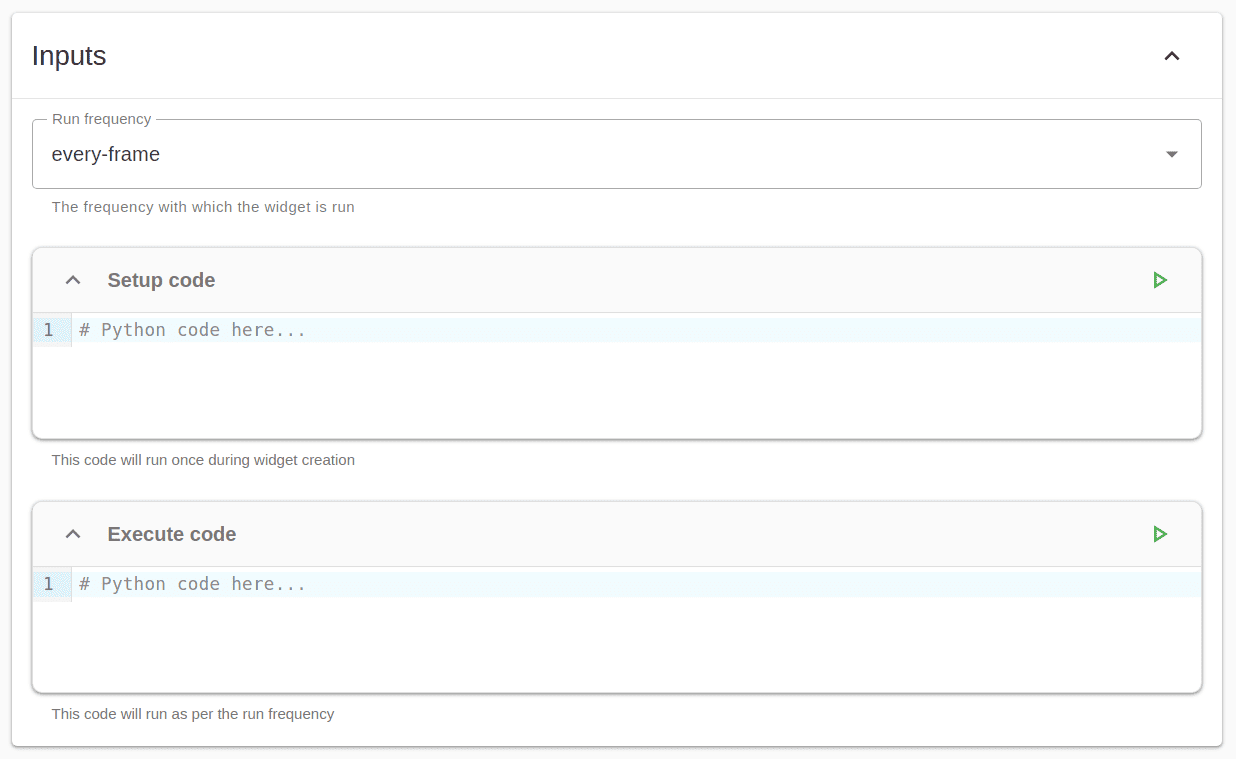
The code under Setup code is executed only once at the time of widget creation. Examples of code that goes here would be common functions, class definitions, initializations etc.
The code under Execute code is executed as per the chosen run frequency. The outputs of this code will show up as the widget outputs. The outputs can include both text and images. Any errors, including syntax errors and code errors will show up in the output as well.
The global variable
upoints to the current MDAnalysisUniverseand can be used directly in the code. There is support for code complete and inspect as shown below: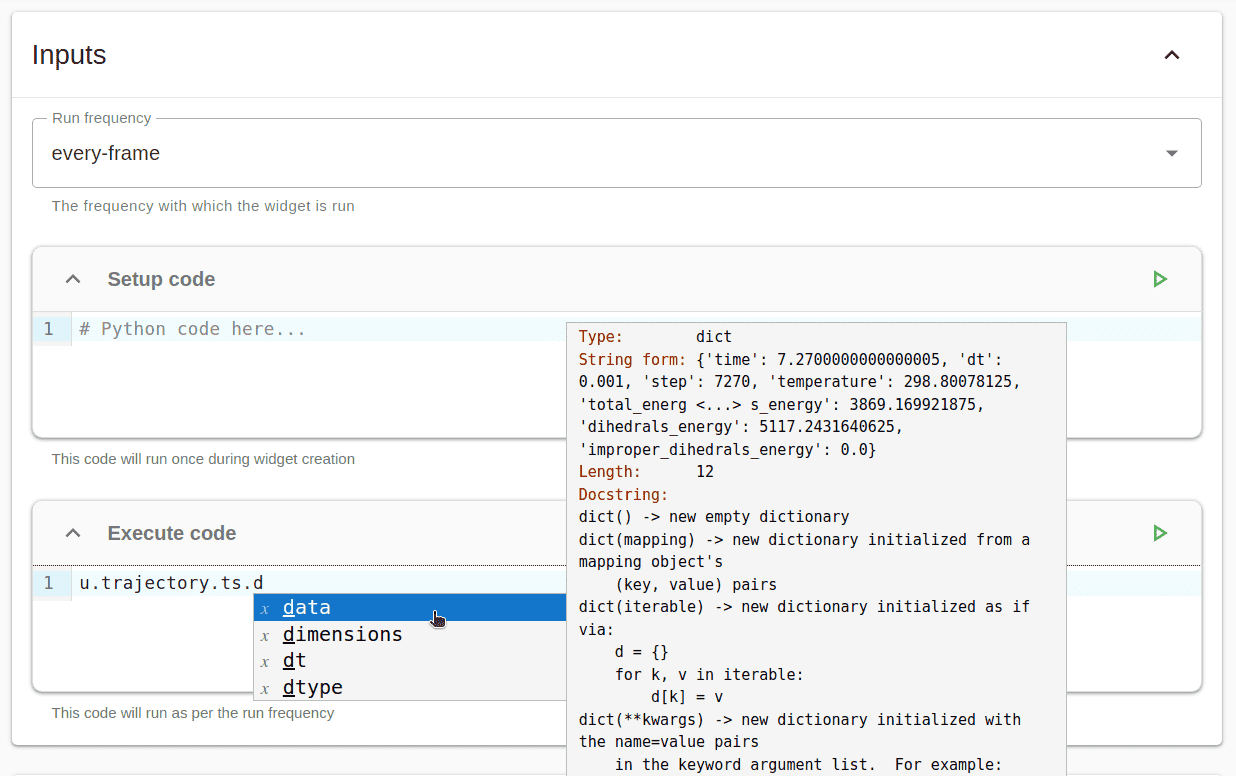
Examples
Example 1: Box volume
To print the current box volume, the following can be used in the Execute code:
print(f"Box Volume = {u.trajectory.ts.volume:.2f} ų")
Example 2: Kinetic Energy of an AtomGroup
To print and display the Kinetic Energy of an
AtomGroupa simple KE function and plot can be defined in the Setup code as follows (executes only once):import numpy as np from collections import deque import matplotlib.pyplot as plt def ke(ag): return 0.5 * np.sum(ag.masses[:, np.newaxis] * (ag.velocities**2)) class SimplePlot: def __init__(self, universe, max_values=100): self.u = universe self.times = deque(maxlen=max_values) self.values = deque(maxlen=max_values) def show(self, name, values): self.values.append(values) self.times.append(self.u.trajectory.ts.data["time"]) plt.plot(self.times, self.values) plt.ylabel("Values") plt.xlabel("Time (ps)") plt.title(name) plt.grid(True) plt.show() plt1 = SimplePlot(u)
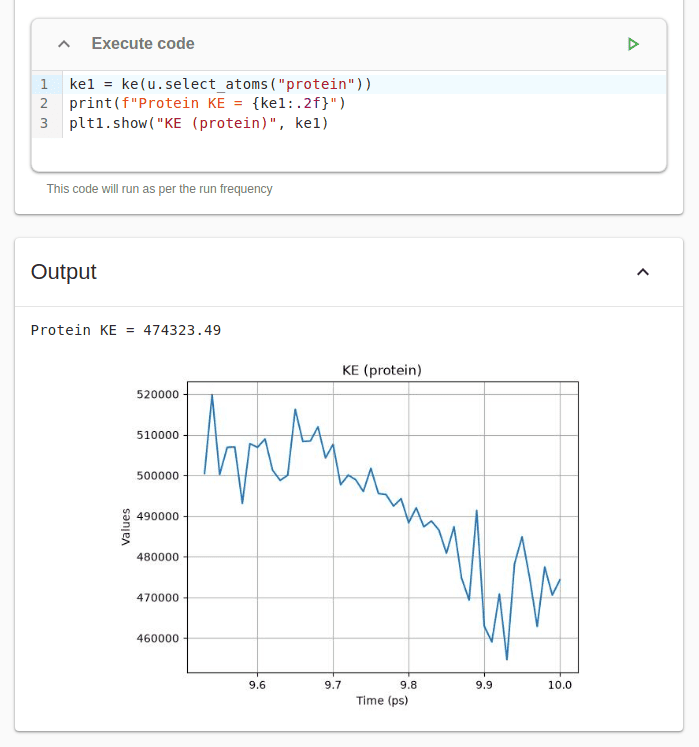
The above function and plot can be invoked in the Execute code section as follows:
ke1 = ke(u.select_atoms("protein"))
print(f"Protein KE = {ke1:.2f}")
plt1.show("KE (protein)", ke1)
Here is an example of the widget output when the widget is running:
Note
Variables created in custom code blocks are common across the dashboard kernel and hence must be chosen to not overwrite each other.
- description = 'Custom user-defined code'
- name = 'Custom Code'